Server Monitoring Using Prometheus
Currently, I have 3 servers at my disposal and I use Ansible to automate their maintenance and changes. After making these changes, it is possible that one of them consumes a greater amount of memory, CPU usage, or disk space. For simple cases, the utility BTOP is more than sufficient, as it provides a brief summary of resource usage and the processes occupying those resources on the server. However, for cases where prolonged resource analysis is required or even alarms to detect failures/approaches to the system’s maximum requirements, immediate system monitoring alone is not enough; constant monitoring is required. In this post, I will show my current monitoring system using Grafana alongside Prometheus to monitor my servers.
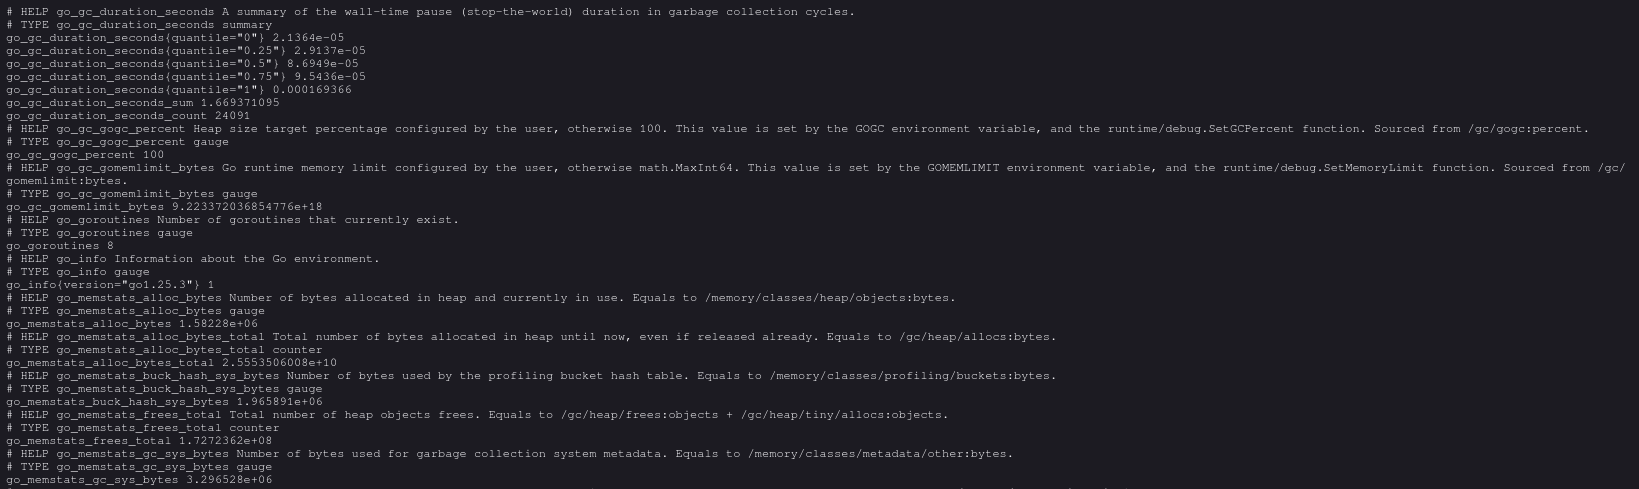
Node Exporter
Node Exporter is a service that exposes an API with a snapshot of the server’s metrics. To run this service, you can use the following docker compose:
 1---
 2services:
 3  node_exporter:
 4    image: quay.io/prometheus/node-exporter:latest
 5    container_name: node_exporter
 6    command:
 7      - "--path.rootfs=/host"
 8      - "--web.config.file=/etc/prometheus/web.yml"
 9    ports:
10      - 9100:9100
11    pid: host
12    restart: unless-stopped
13    volumes:
14      - '/:/host:ro,rslave'
15      - ./NodeExporter/web.yml:/etc/prometheus/web.yml
To ensure this service is not exposed freely, you can generate a file that sets a username and password; in my case, the file web.yml will be:
1basic_auth_users:
2  {{ nodeexporter_user }}: {{ nodeexporter_pass }}
Finally, this service can be behind a reverse proxy; here is an example configuration using NGINX:
server {
    server_name subdomain.domain.com;

    location / {
        proxy_pass http://localhost:9100;
        proxy_set_header Host $host;
        proxy_set_header X-Real-IP $remote_addr;
        proxy_set_header X-Forwarded-For $proxy_add_x_forwarded_for;
        proxy_set_header X-Forwarded-Proto $scheme;
    }
}
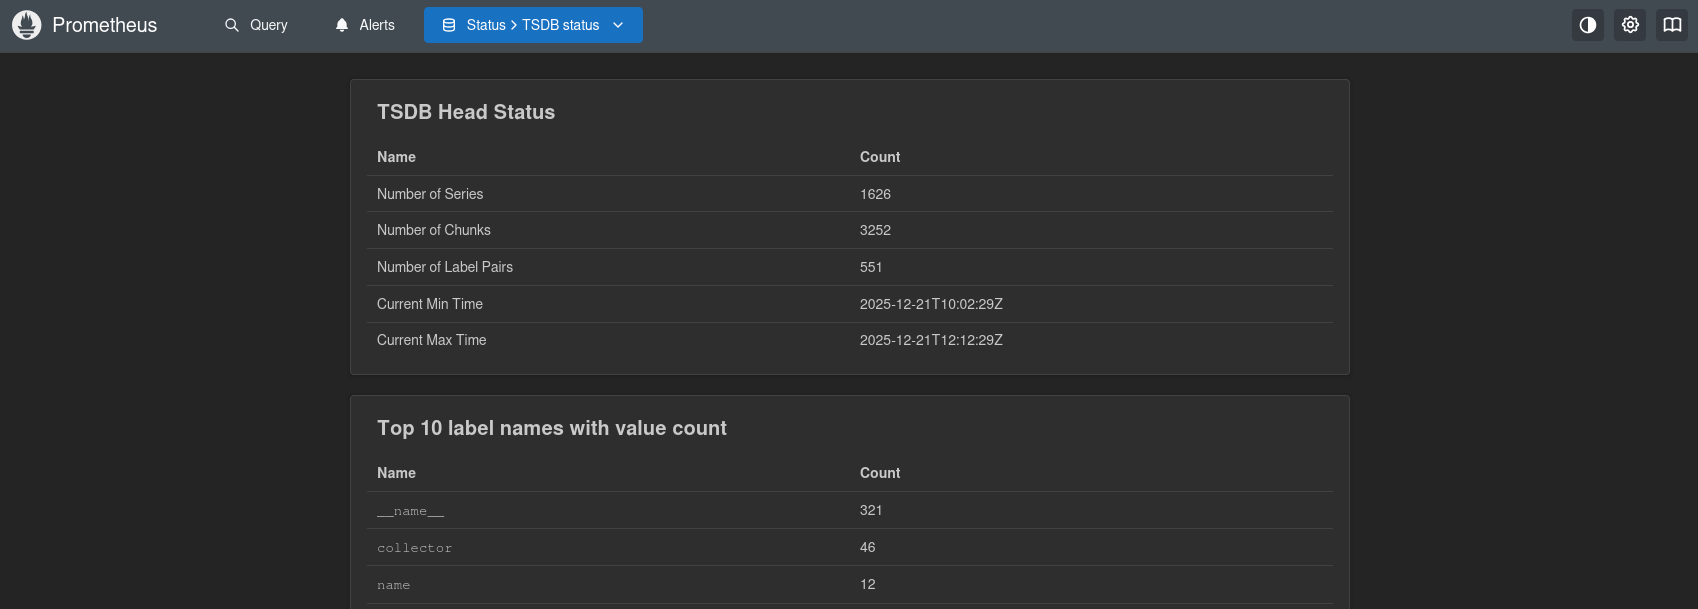
Prometheus
Prometheus is a program that retrieves data from the configured metrics APIs, with these metrics having a default lifespan of 14 days. For my configuration, I only use one Prometheus database that makes requests to the other servers and itself. To run a Prometheus database, you can use the following docker compose:
 1---
 2services:
 3  prometheus:
 4    image: prom/prometheus:latest
 5    user: "1000:1000"
 6    volumes:
 7      - ./Prometheus/prometheus-data:/prometheus
 8      - ./Prometheus/prometheus.yml:/etc/prometheus/prometheus.yml
 9    ports:
10      - "9090:9090"
11    network_mode: host
12    restart: unless-stopped
Next, you will configure the configuration file prometheus.yml as follows:
 1global:
 2  scrape_interval: 5m
 3
 4scrape_configs:
 5- job_name: "Server1"
 6  static_configs:
 7    - targets: ["sub1.url1.com"]
 8  basic_auth:
 9    username: "Username1"
10    password: "Password1"
11- job_name: "Server2"
12  static_configs:
13    - targets: ["sub2.url1.com"]
14  basic_auth:
15    username: "Username2"
16    password: "Password2"
17- job_name: "HomeServer"
18  static_configs:
19    - targets: ["localhost:9100"]
20  basic_auth:
21    username: "Username3"
22    password: "Password3"
This way, we will have a database that will collect data from the servers every 5 minutes and store it with different labels.
 It is important to note that in the current configuration, anyone can access Prometheus and therefore the databases we have tried to secure. For this reason, the official documentation recommends using credentials for this URL or limiting access through firewall rules. To create a protected URL, you can use, for example:
1sudo htpasswd -c /etc/nginx/.htpasswd adminserver {
server_name subdomain.domain.com;
location / {
auth_basic "Restricted Access";
auth_basic_user_file /etc/nginx/.htpasswd;
proxy_pass http://localhost:9090;
proxy_set_header Host $host;
proxy_set_header X-Real-IP $remote_addr;
proxy_set_header X-Forwarded-For $proxy_add_x_forwarded_for;
proxy_set_header X-Forwarded-Proto $scheme;
}
}Grafana
Prometheus already stores the data, can display it via queries, and can generate alerts, but the interface is not as nice and intuitive as that of Grafana. For this reason, personally, I prefer to add the Prometheus data source and visualize it through the pre-built interface of NodeExporterFull. To run Grafana, we can use the following docker compose:
---
services:
  grafana:
    image: grafana/grafana-enterprise
    container_name: grafana
    restart: unless-stopped
    user: '0'
    ports:
      - '3000:3000'
    volumes:
      - './Grafana/data:/var/lib/grafana'
    network_mode: host
With this, we will have complete monitoring of all our services, with the possibility of generating alerts, all encrypted, so that only we can visualize this data.

